
Screenshots and recordings from the product
Workflows built with Ciaren
Visual ETL, data cleaning, analytics, and machine-learning workflows. Every screenshot and recording below is the real editor running on real data.
Workflows
Browse by category
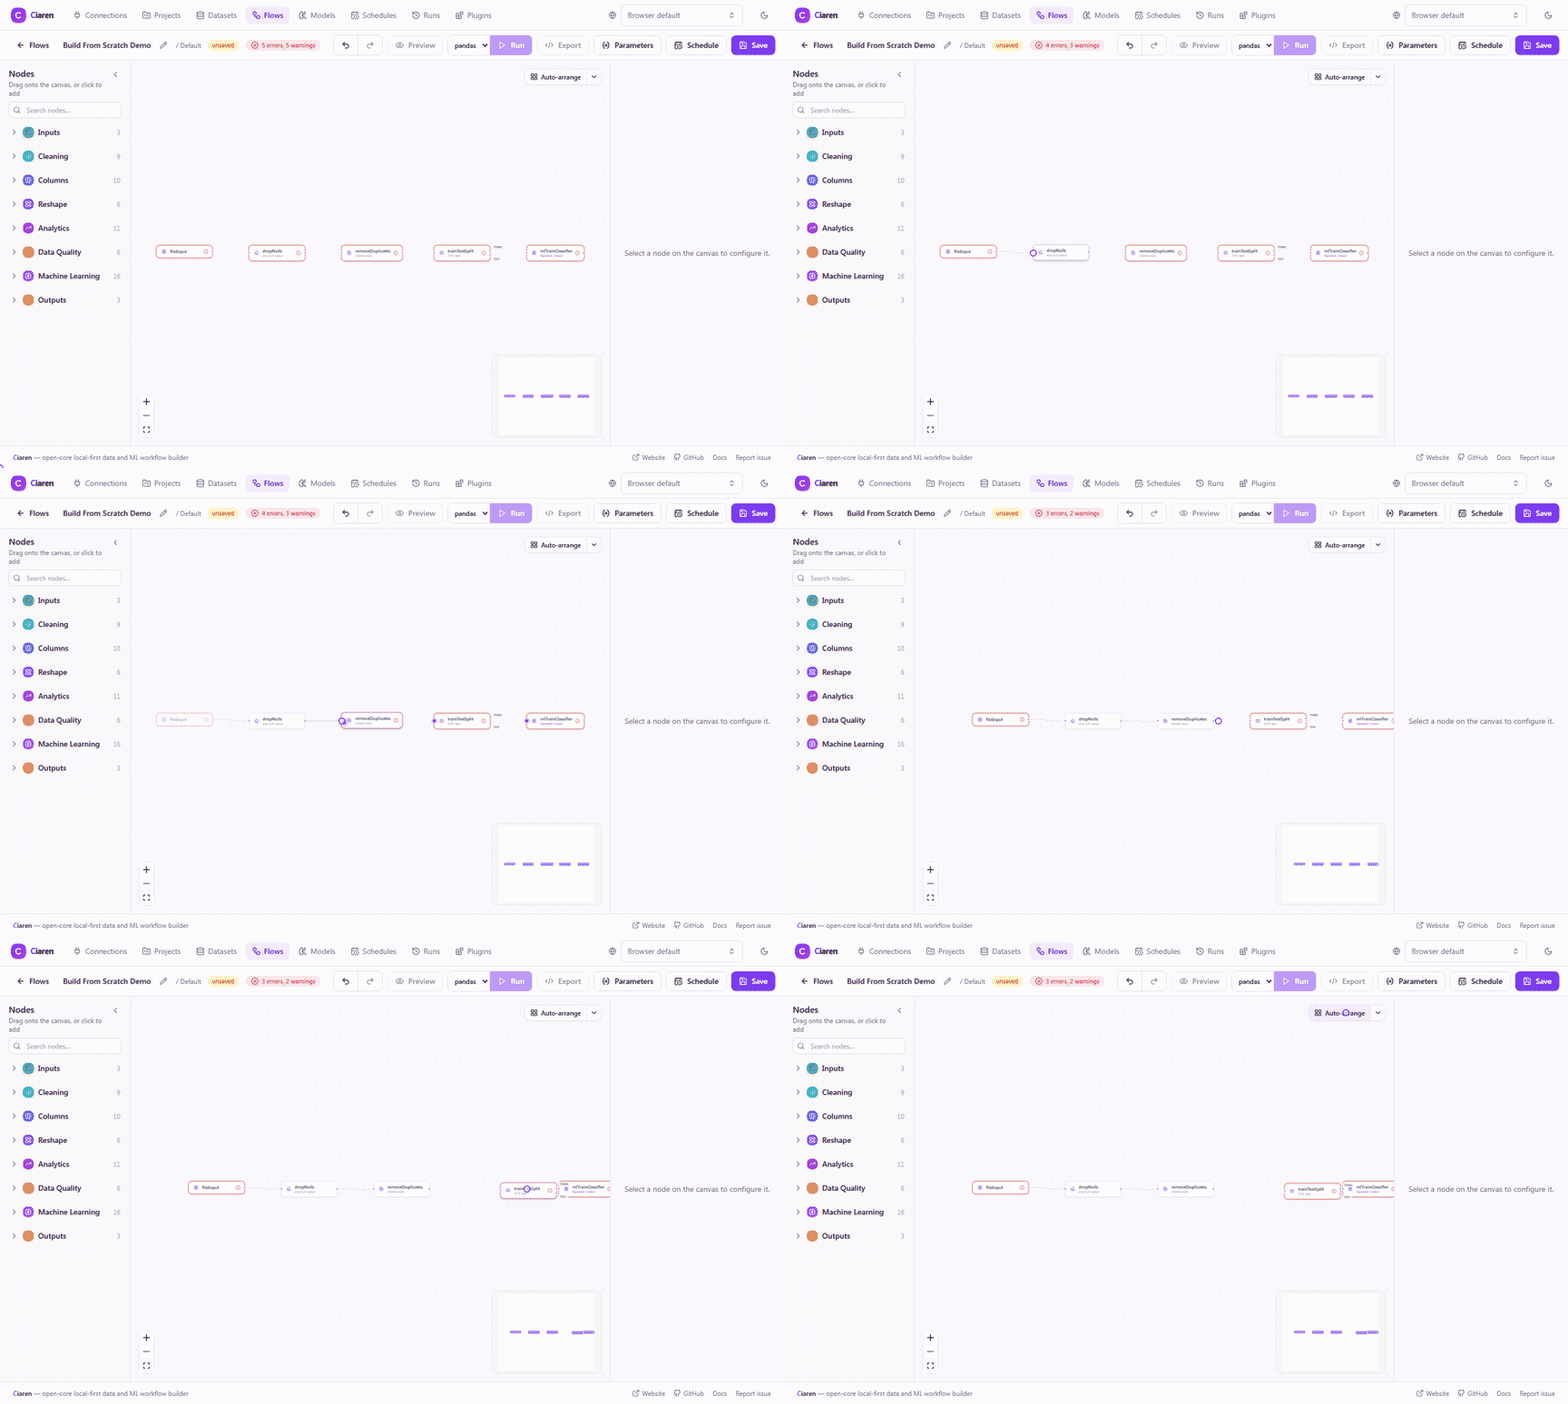
Build an ETL flow from scratch
Drag a CSV input onto the canvas, chain filter and aggregate nodes, and wire an output. That is a complete extract-transform-load pipeline without writing code.
- CSV
- Filter Rows
- Group & Aggregate
- Polars
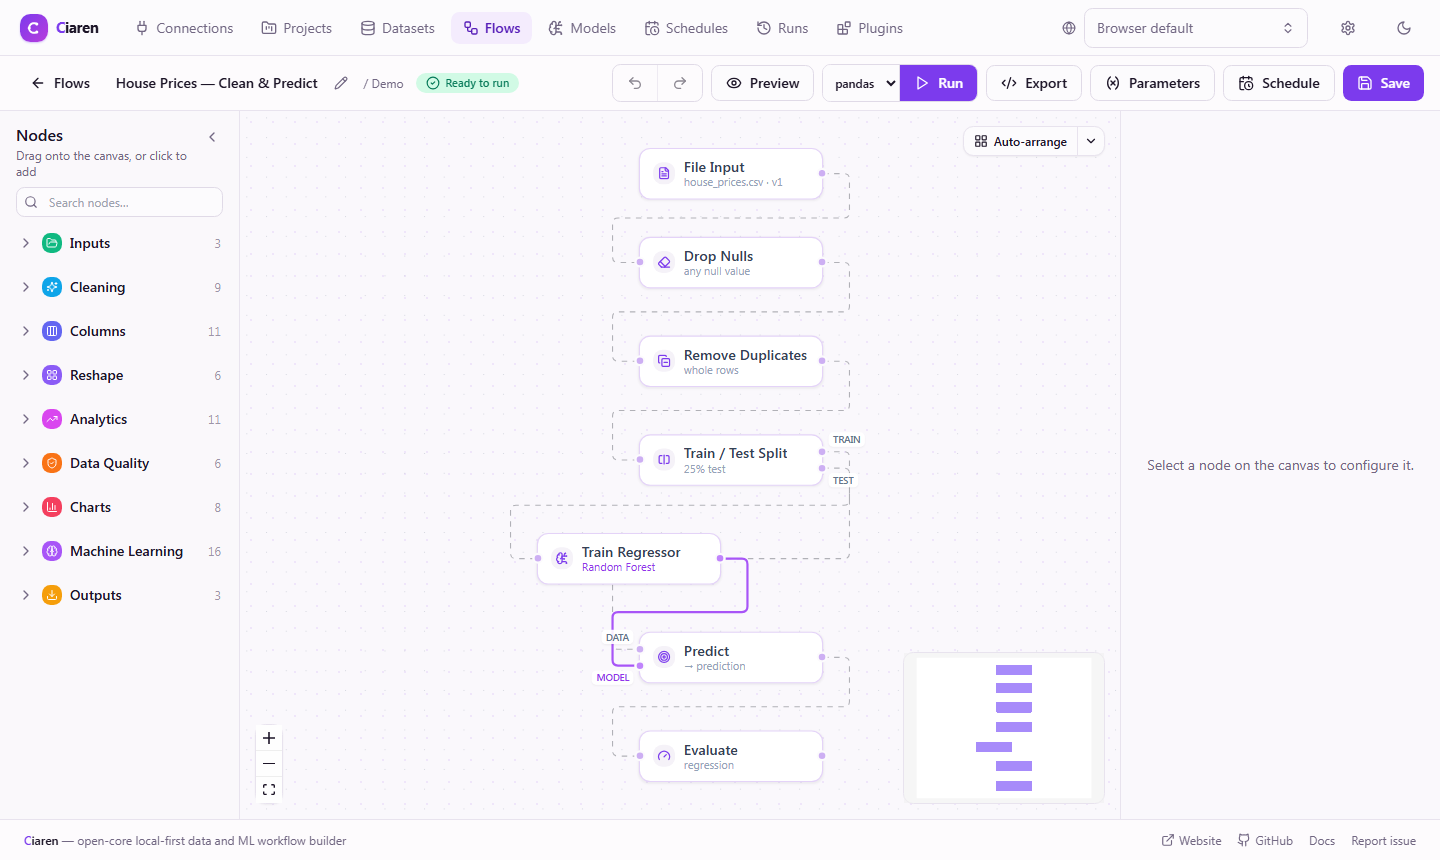
Order status prediction
An end-to-end ML pipeline: clean customer and order data, join the sources, scale features, split train/test, train a random forest, and chart the predictions.
- Join
- Scale Features
- Random Forest
- scikit-learn
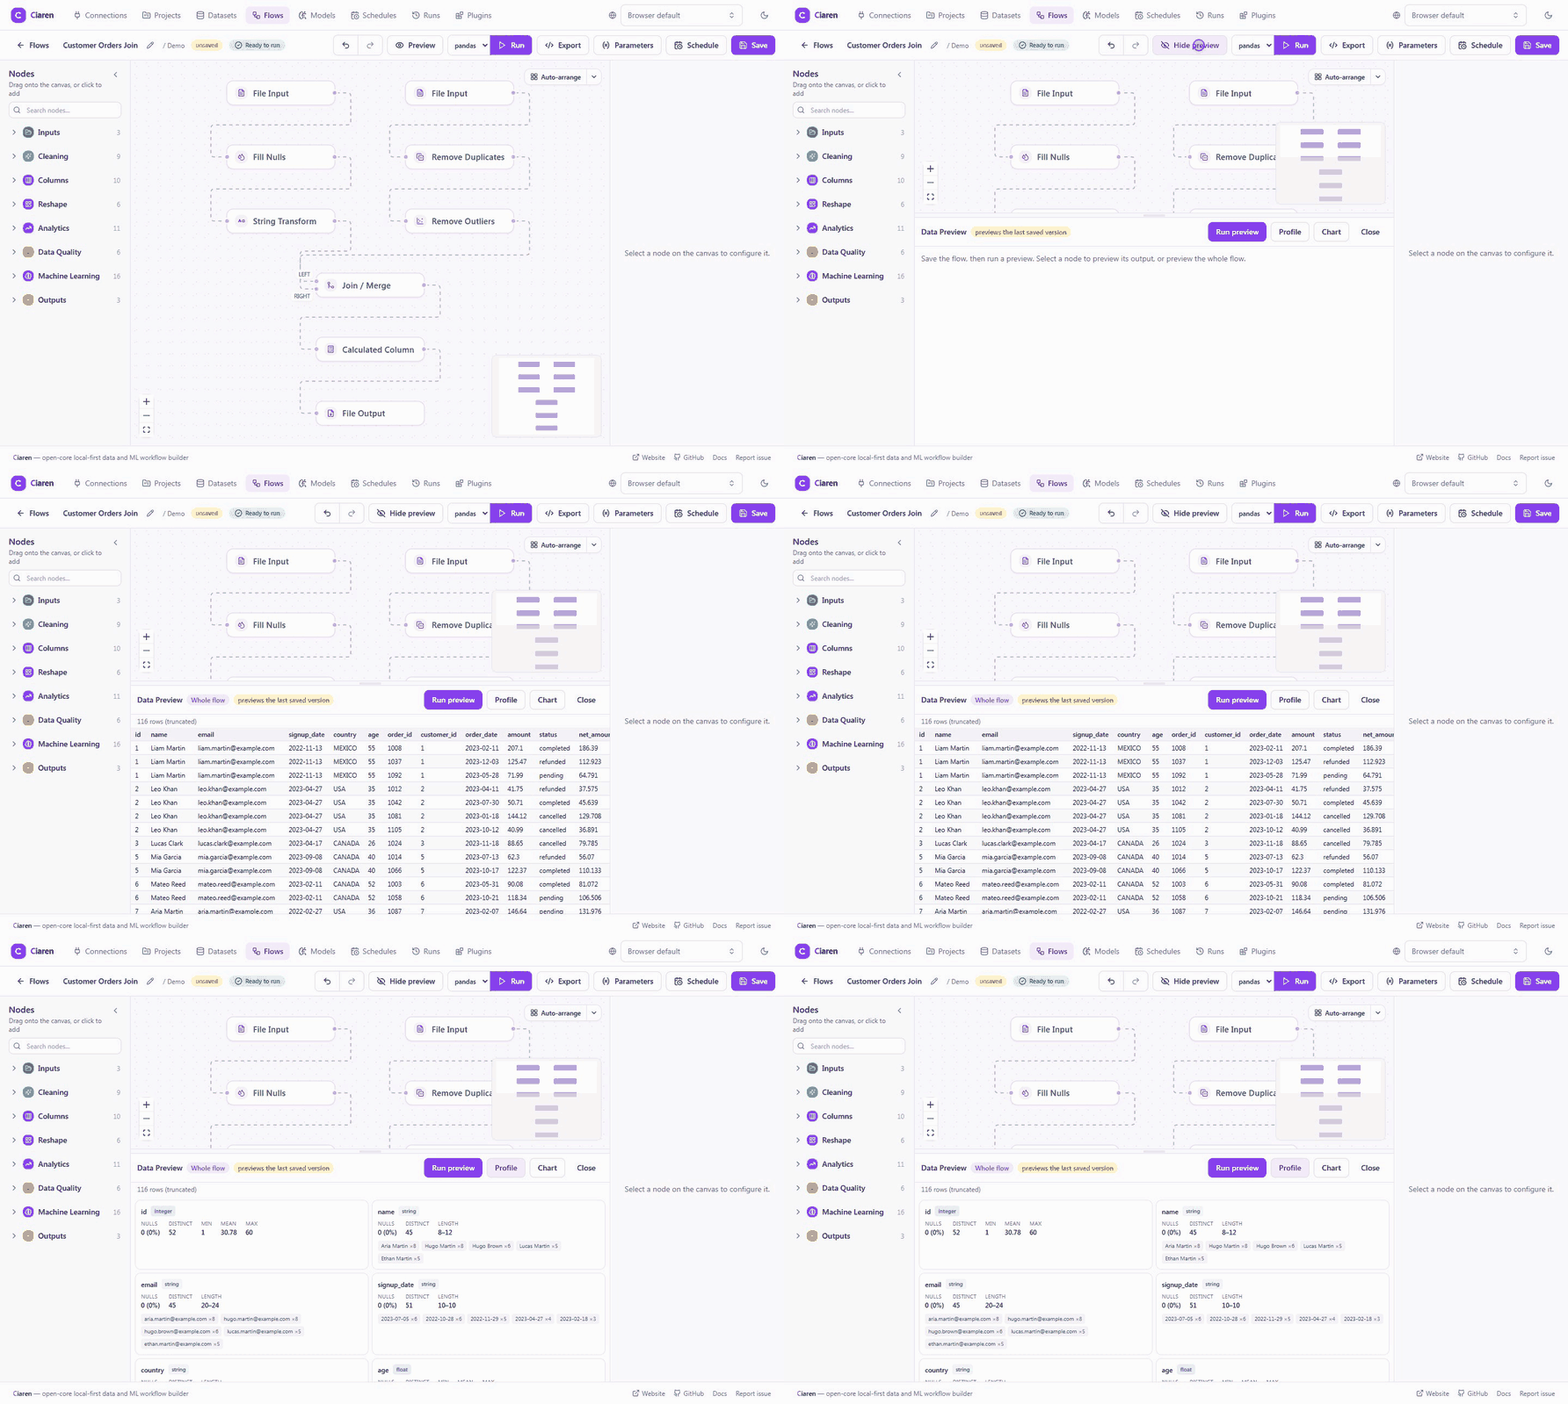
Preview every step on real data
Click any node to inspect its actual output (rows, columns, and types) before running anything downstream. A bad join shows up before it costs you a full run.
- Data Preview
- Fill Nulls
- Remove Duplicates
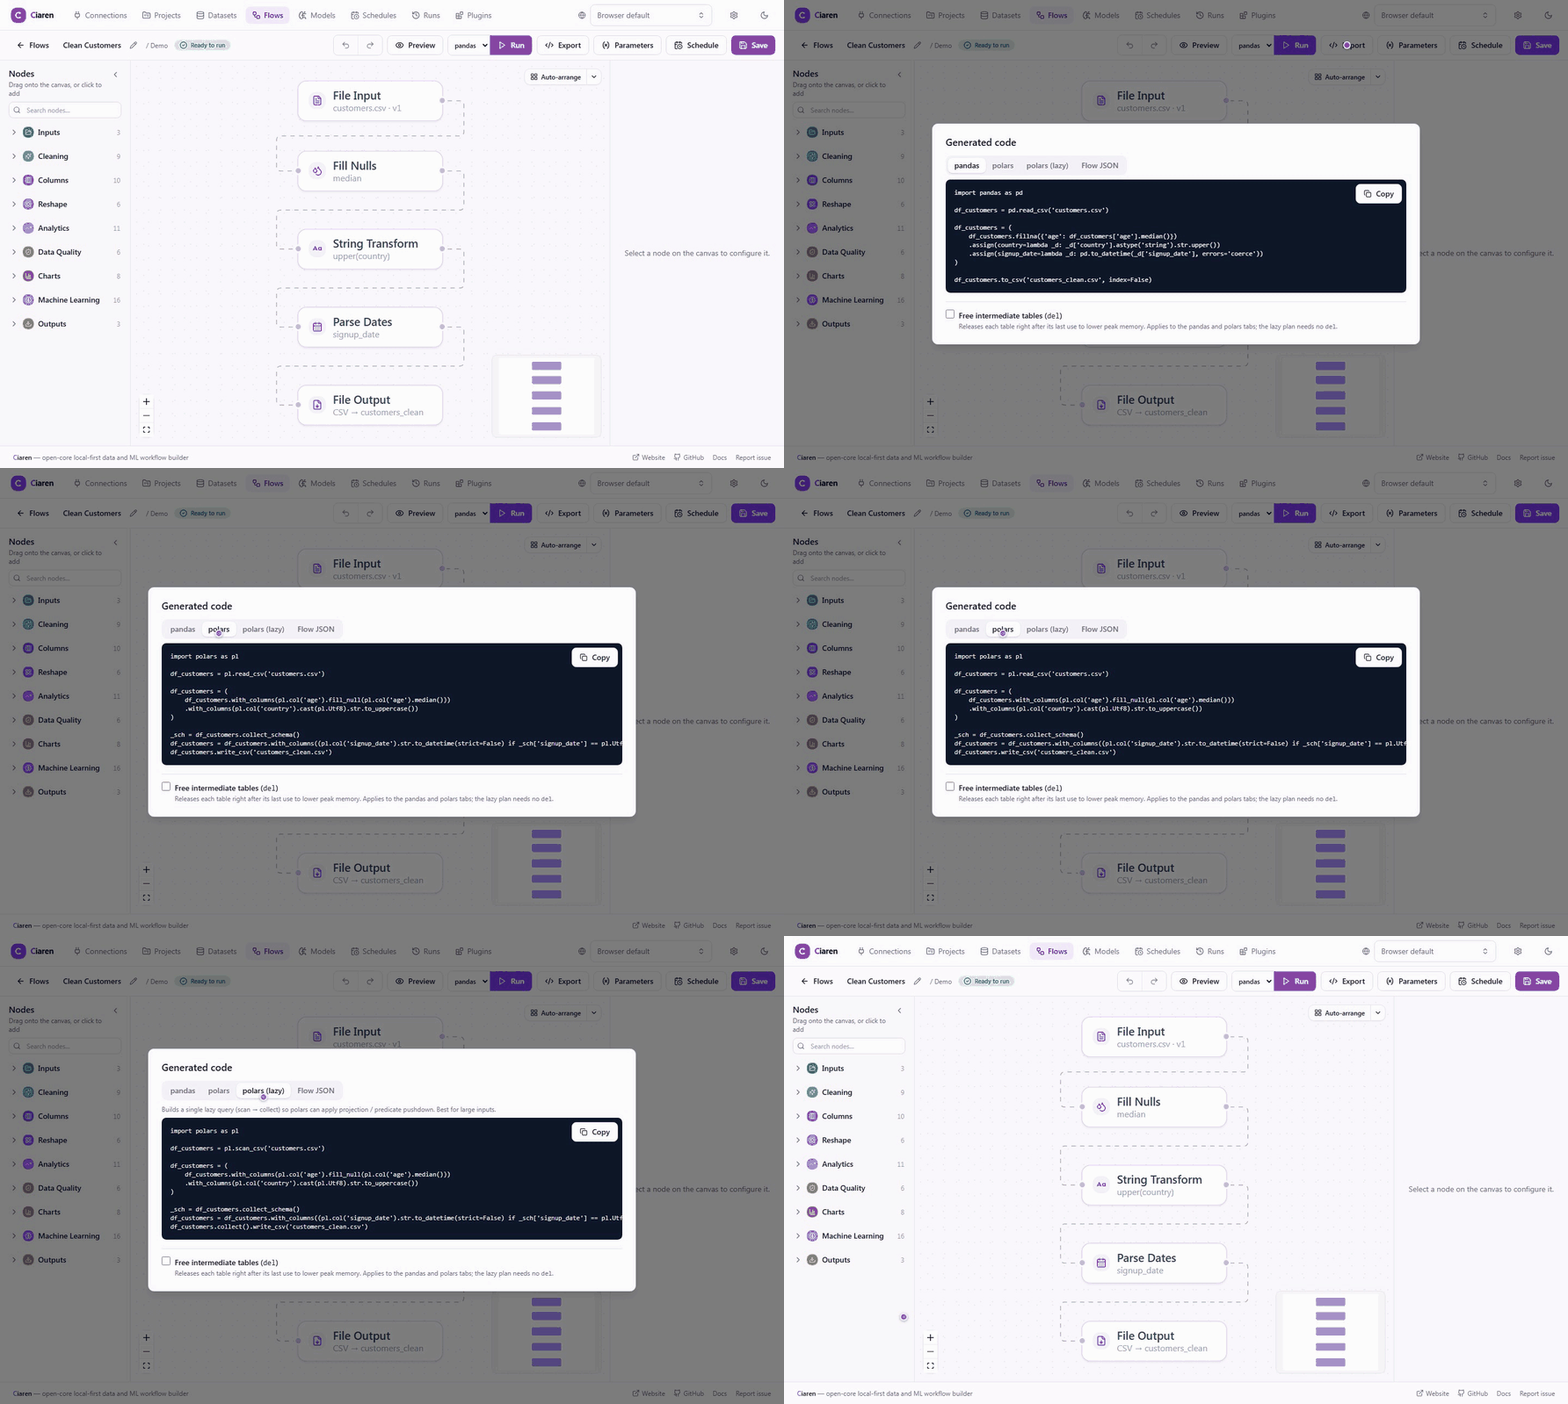
Export the flow as Python
One click turns the visual pipeline into a standalone, readable pandas, Polars, or lazy Polars script that runs anywhere Python runs, without Ciaren installed.
- pandas
- Polars
- Code generation
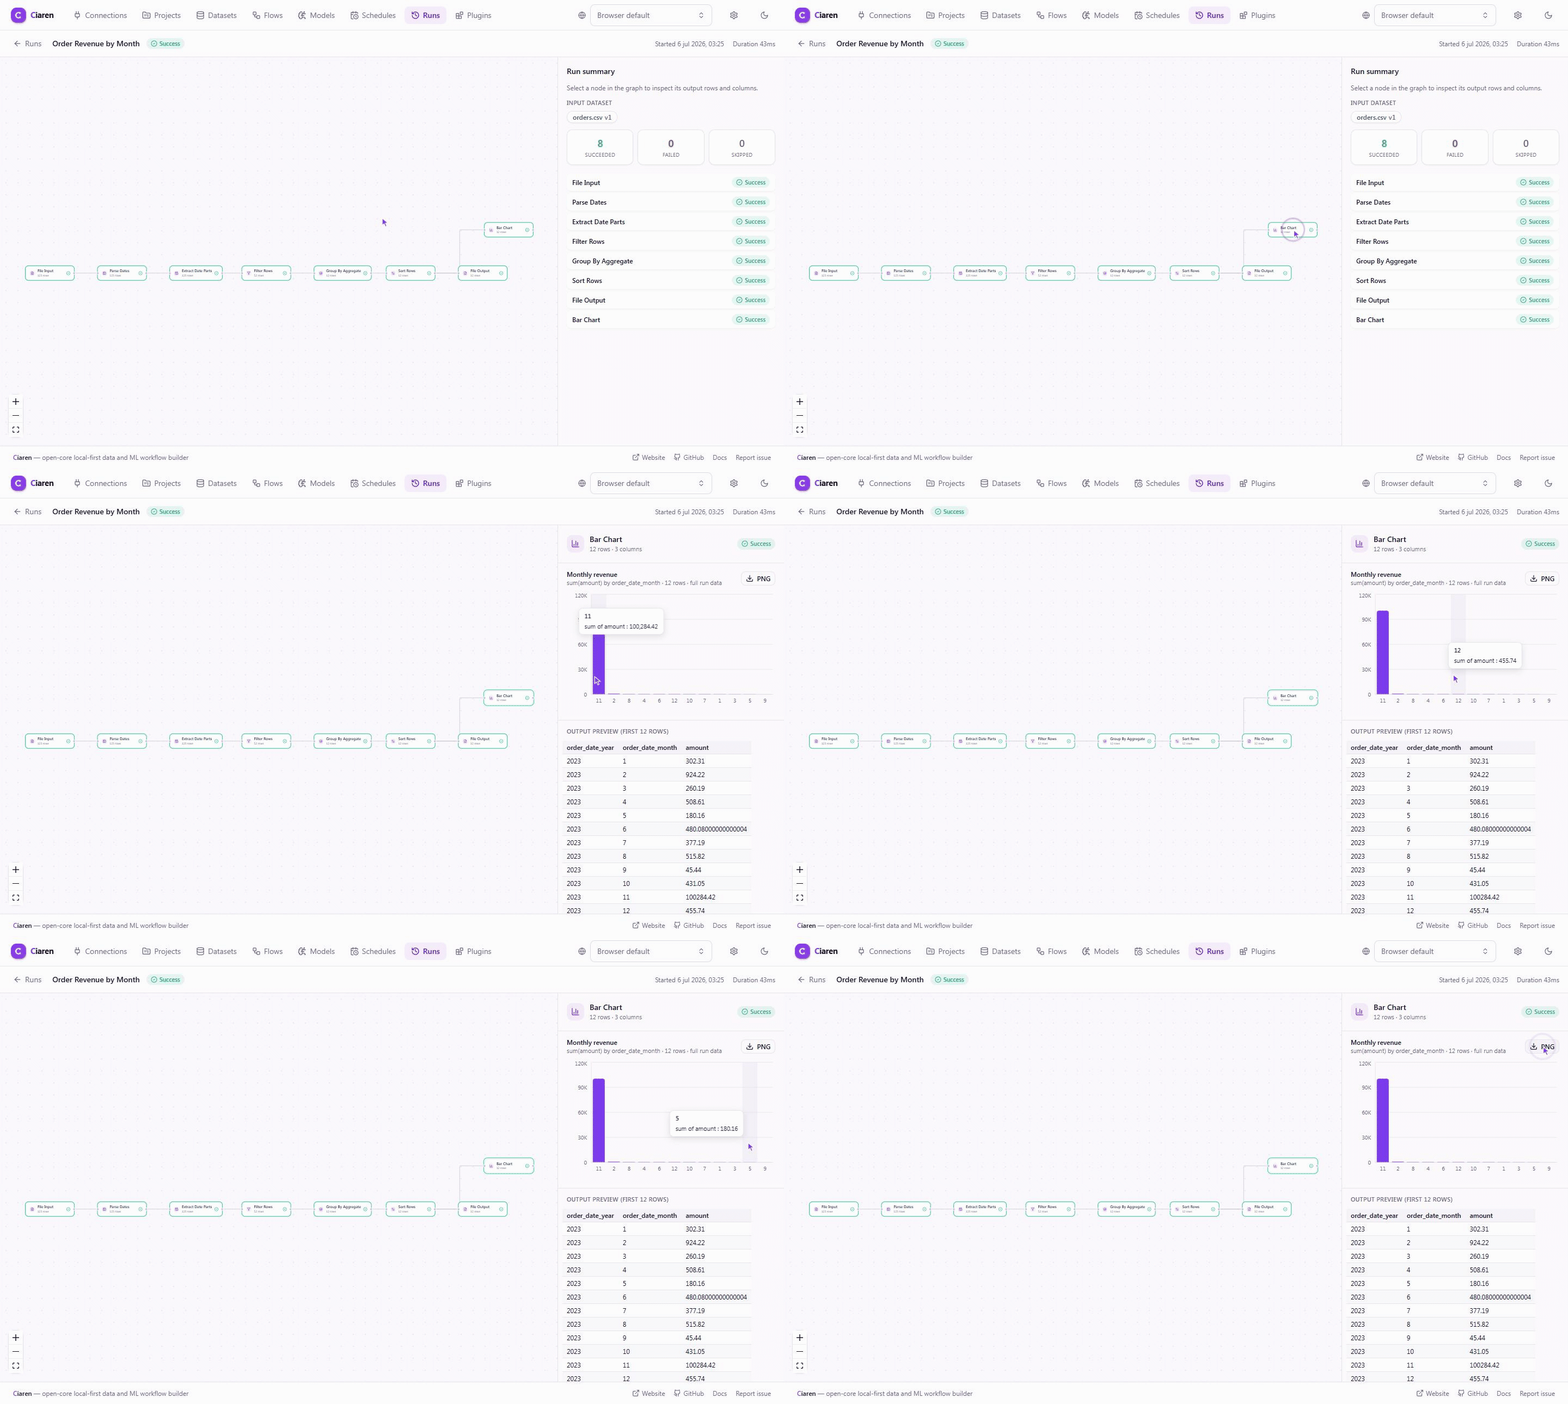
Sales analytics with charts
Aggregate revenue by region and render it as a bar chart directly in the flow. Eight chart node types cover bars, lines, scatter, heatmaps, and more.
- Group & Aggregate
- Bar Chart
- Polars
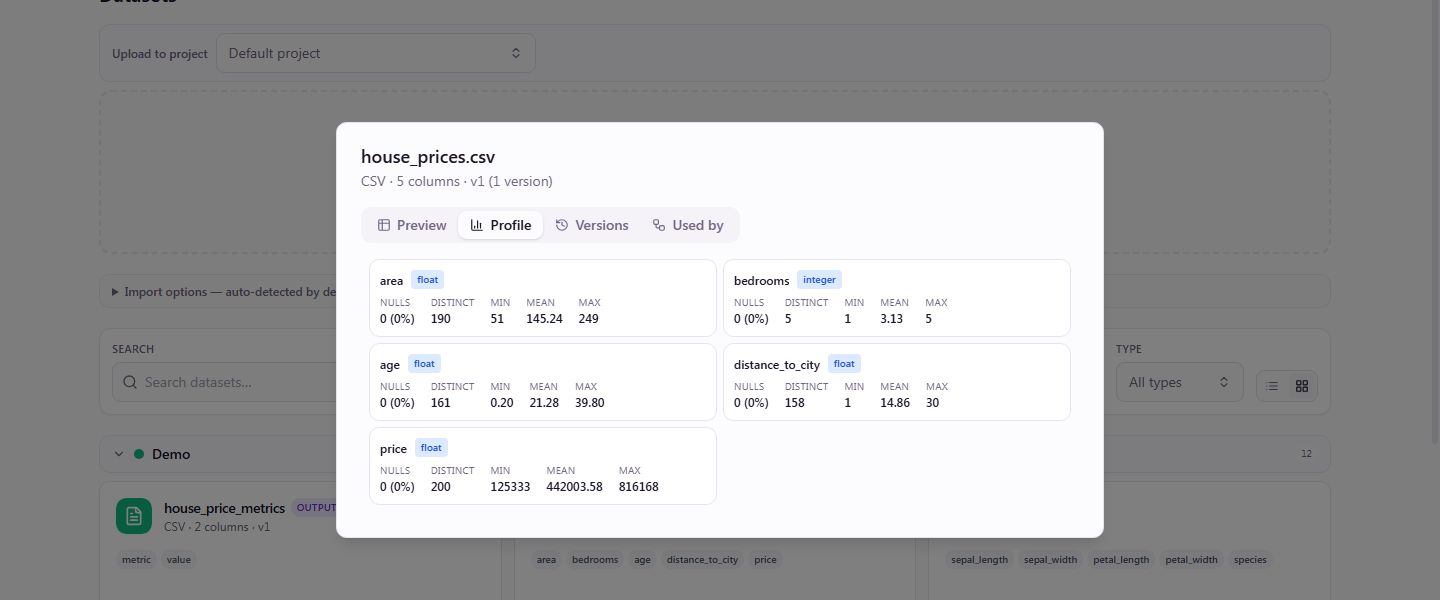
Profile a dataset before you build
Column types, null counts, distributions, and summary statistics for any dataset, before the first node goes on the canvas.
- Dataset profiling
- Schema inspection
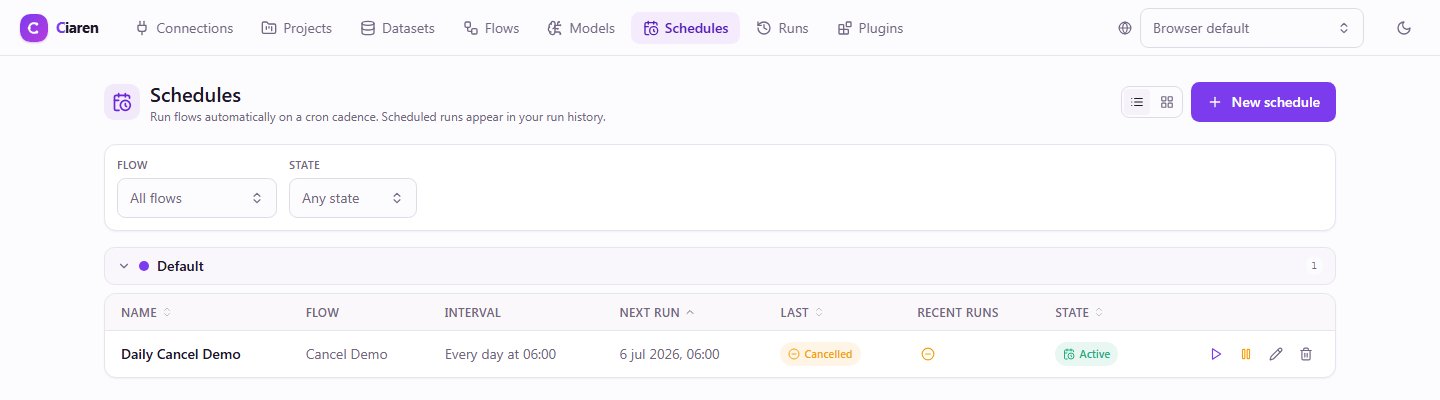
Run pipelines on a schedule
Hourly, daily, weekly, or full cron expressions, with retries, catch-up runs, and auto-disable on repeated failure. Schedules are timezone-aware, including DST.
- Cron scheduler
- Retries
- Run history
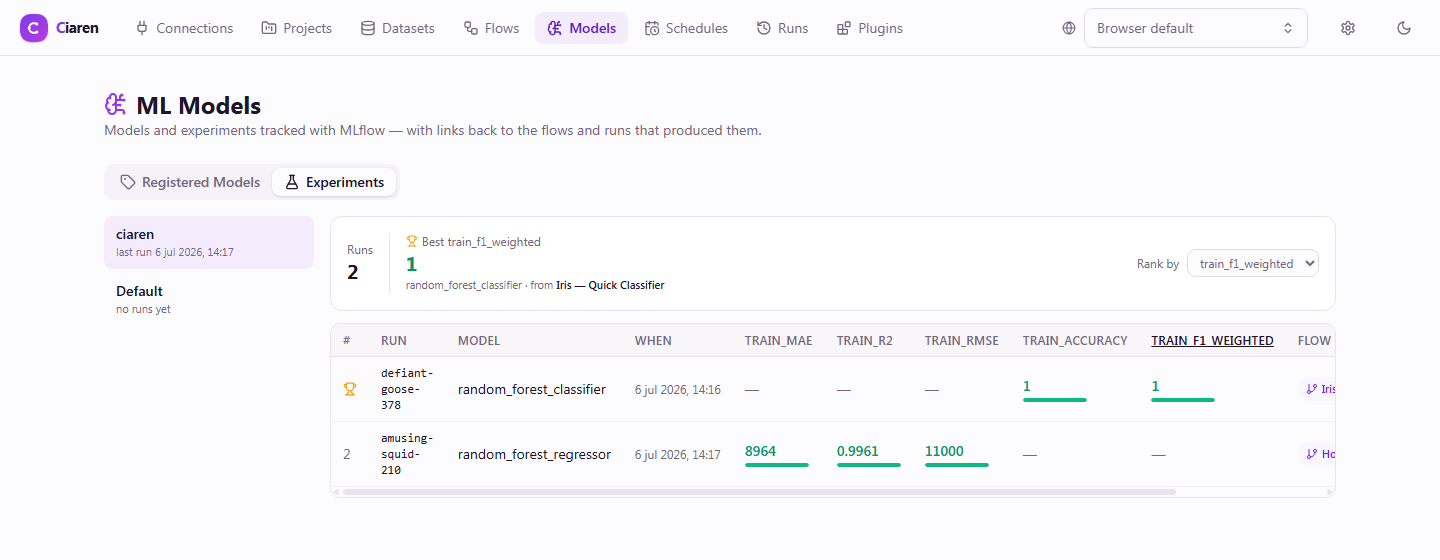
Track every model in MLflow
Each training run logs parameters, metrics, and the model itself to MLflow automatically. Compare experiments and load any registered model back into a flow.
- MLflow
- Experiment tracking
- Model registry
Build your own
Install Ciaren locally, drop a CSV on the canvas, and export Python when you're done.