
Demo Project & Tutorials
For: anyone who finished the Quick Start or learns best from working examples. You get: four guided tutorials on flows that are already in your Demo project, from a linear cleanup to a three-input sales mart.
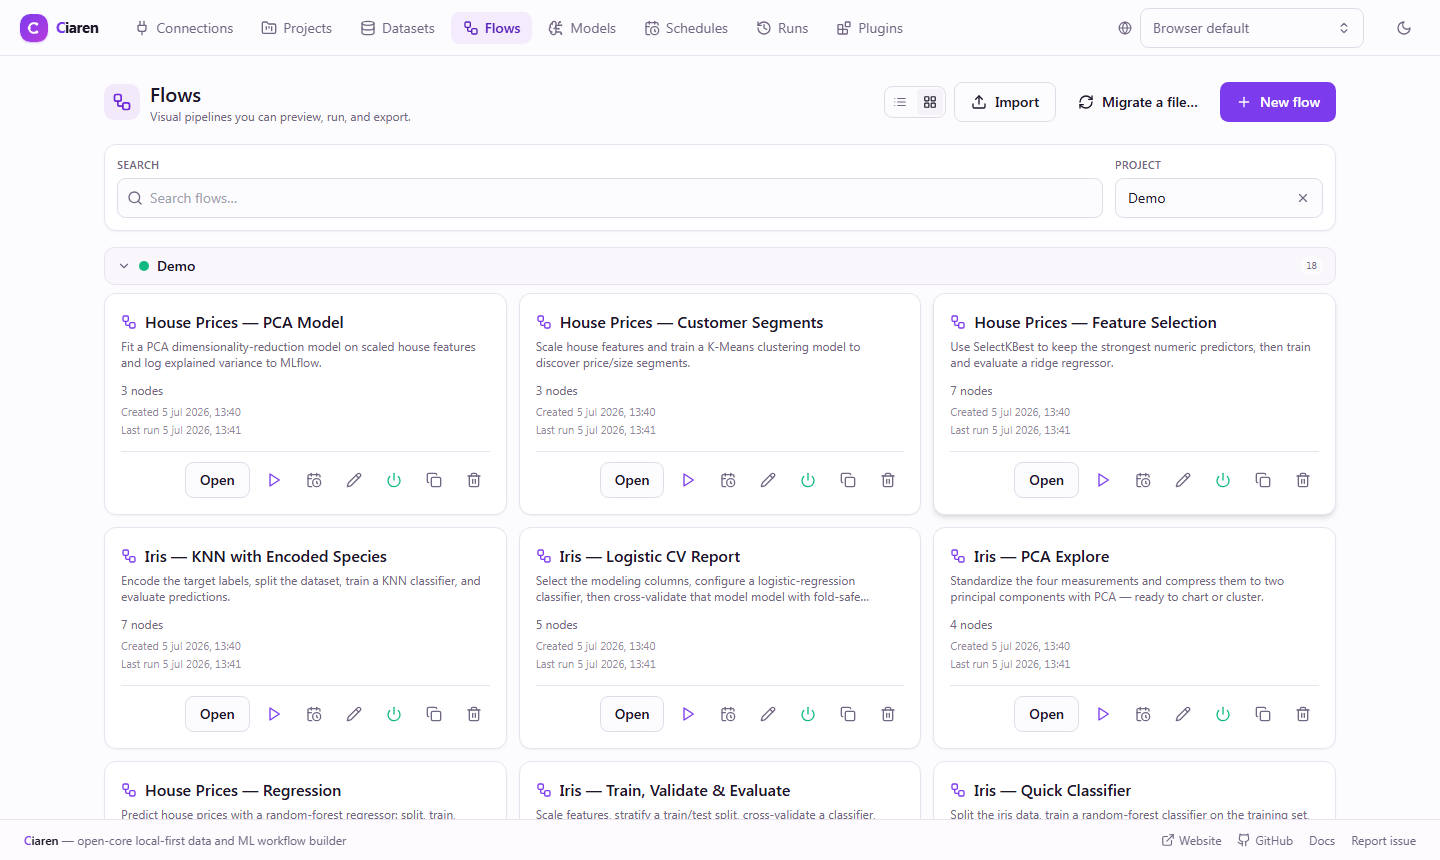
The built-in Demo project contains 11 sample datasets and 18 example
flows. Open each tutorial flow, preview every step, and tweak it. The other
14 flows cover more cleaning and data-quality patterns plus ML work (PCA,
clustering, feature selection, regression, cross-validation, and more) on
datasets like house_prices.csv and iris.csv.
Where the demo comes from
The Demo project is created automatically the first time the server starts on a fresh database. You don't run anything — open the app and it's there under Projects → Demo (the emerald one).
The data is generated from a fixed random seed, so every install gets the exact same rows. That's what makes these tutorials reproducible: the numbers you see are the numbers described here.
Don't want it?
Skip seeding with ciaren serve --no-demo, or set
CIAREN_SEED_DEMO=false. Seeding is also idempotent — once the Demo project
exists it's never recreated, so deleting it keeps it gone.
The sample datasets
The four datasets used by the tutorials below are CSVs and intentionally
messy — they have nulls, outliers, duplicates, inconsistent casing, and
dates stored as text — so the example flows have something realistic to clean.
(The Demo project ships 11 datasets in total; the other seven —
house_prices.csv, iris.csv, regional_actuals.csv, regional_targets.csv,
survey_responses.csv, web_events.csv, and leads.csv — feed the newer
ML-focused and data-quality flows mentioned above.)
| Dataset | Rows | Columns | What's messy |
|---|---|---|---|
customers.csv | 60 | id, name, email, signup_date, country, age | signup_date is text; country casing is inconsistent (usa/USA/Usa); age has nulls and two absurd outliers (199, 0) |
orders.csv | 123 | order_id, customer_id, order_date, amount, status | order_date is text; amount has two huge outliers; 3 duplicate rows |
products.csv | 12 | product_id, category, price, rating | price has nulls |
order_items.csv | ~one–two per order | order_id, product_id, quantity, unit_price | the link table joining orders to products |
See the mess for yourself
Open any dataset, or drop a File Input node (File type: CSV) and hit Run preview. Switch
the preview to Chart → Histogram on amount to see the outliers, or to
Profile to spot the null counts. (Charts use a sample — see
Visualizations.)
Tutorial 1 — Clean Customers (linear)
Flow: Clean Customers · Goal: turn the raw customer list into a tidy table — fill missing ages, normalize country casing, and make the signup date a real date.
This is the simplest shape: a straight line from input to output.
- 1InputFile Inputcustomers.csv
- 2CleanFill Nullsage →
median - 3CleanString Transformcountry →
upper - 4CleanParse Datessignup_date →
datetime - 5OutputFile Output
- File Input (File type: CSV) →
customers.csv. - Fill Nulls — column
age, strategy median. (Some ages are blank; median is robust to those 199/0 outliers.) - String Transform — column
country, operation upper. Nowusa,USA, andUsaall becomeUSA. - Parse Dates — column
signup_date, errors coerce. Text like2022-06-14becomes an actual date you can sort and extract parts from. - File Output.
Follow along: select each node and Run preview to watch the column
change one step at a time. Select String Transform and you'll see country
collapse to a handful of clean values.
Try it: add a Group By Aggregate after step 3 (group by country,
count id) to see customers per country — proof the casing fix worked.
Tutorial 2 — Order Revenue by Month (dates + aggregation)
Flow: Order Revenue by Month · Goal: total completed revenue per month, in chronological order.
This adds date-part extraction and grouping.
- 1InputFile Inputorders.csv
- 2CleanParse Datesorder_date →
datetime - 3CleanExtract Date Partsyear + month cols
- 4CleanFilter Rowsstatus = completed
- 5TransformGroup Bysum amount by month
- 6CleanSort Rowsyear →
month asc - 7OutputFile Output
- File Input →
orders.csv. - Parse Dates — column
order_date(it's text). - Extract Date Parts — column
order_date, parts year, month. This addsorder_date_yearandorder_date_monthcolumns. - Filter Rows — keep
status == completed. - Group By Aggregate — group by
order_date_year,order_date_month; aggregateamountwith sum. - Sort Rows — by
order_date_year,order_date_monthascending. - File Output.
Follow along: preview after Extract Date Parts to see the new year/month columns, then after Group By Aggregate to see one row per month.
Try it: select Group By Aggregate, open Chart → Bar, set category =
order_date_month and value = amount to see the monthly revenue shape.
Tutorial 3 — Customer Orders Join (two inputs)
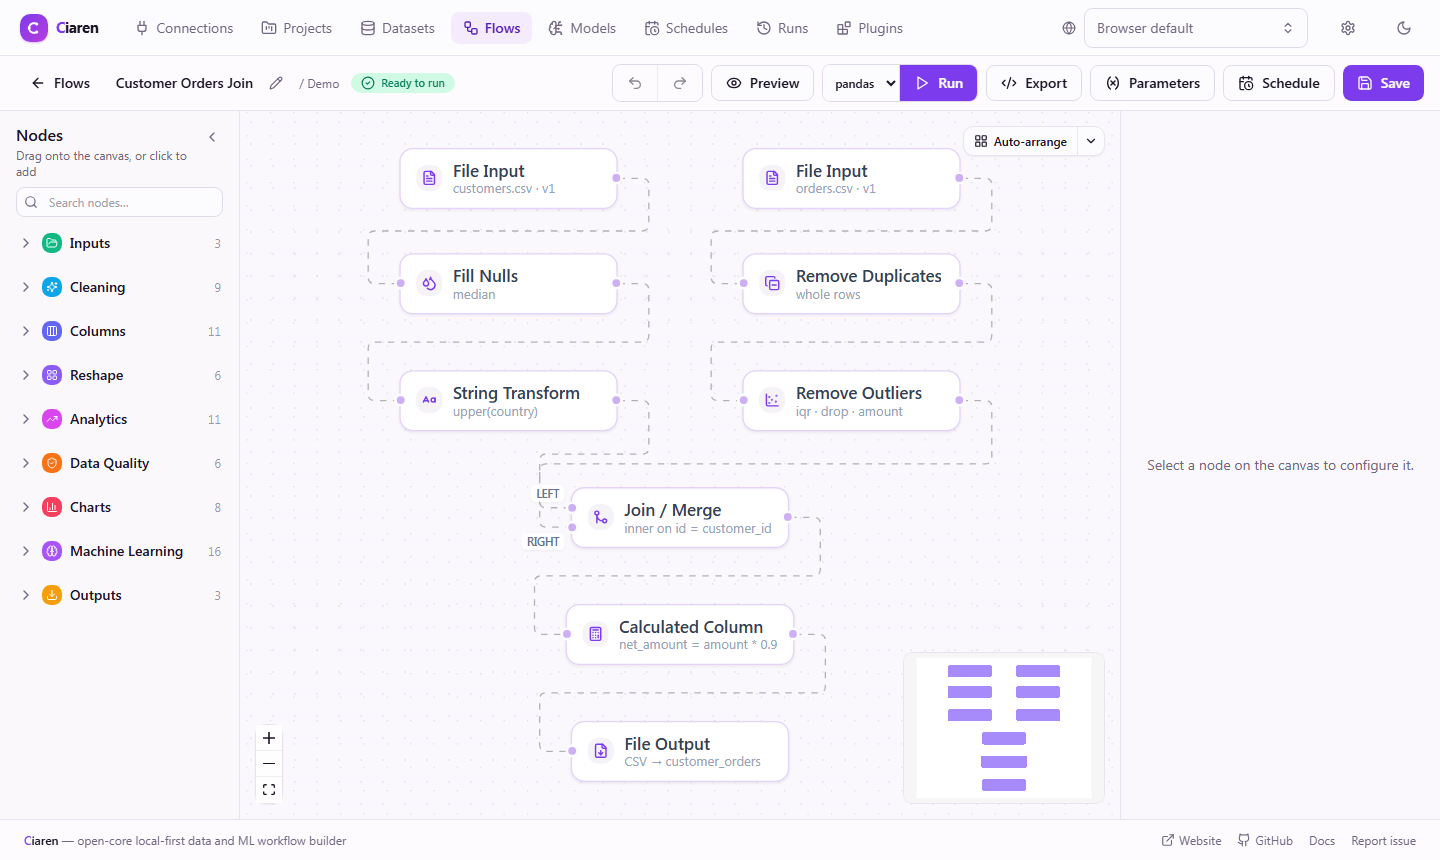
Flow: Customer Orders Join · Goal: clean customers and orders independently, then join them and compute a discounted amount.
This is the first branched flow: two inputs, each with its own cleaning chain, meeting at a Join.
- InputFile Inputcustomers.csv
- CleanFill Nullsage →
median - CleanString Transformcountry →
upper
- InputFile Inputorders.csv
- CleanRemove Duplicates
- CleanRemove OutliersIQR drop
- JoinJoinon customer_id — inner
- TransformCalculated Columnnet_amount = amount × 0.9
- OutputFile Output
Customer branch
- File Input →
customers.csv. - Fill Nulls —
age, median. - String Transform —
country, upper.
Orders branch
- File Input →
orders.csv. - Remove Duplicates — keep first (drops those 3 dupe rows).
- Remove Outliers — column
amount, method IQR, action drop (removes the 99999.99 / 88888.88 rows).
Join & finalize
- Join — left input = customers, right input = orders;
left_on = id,right_on = customer_id, how inner. - Calculated Column —
net_amount = amount * 0.9. - File Output.
Follow along: preview the Remove Outliers node — the row count drops as the outliers leave. Preview the Join to see customer columns sitting next to their orders.
Why two branches? Each side needs different cleaning. Independent branches keep that logic readable, and the Join's left/right handles make the join direction explicit.
Tutorial 4 — Full Sales Mart (three inputs)
Flow: Full Sales Mart · Goal: build a per-category revenue table from three datasets, then label each category by revenue tier.
This is the most complex flow — three inputs and two chained joins.
- Inputorder_items.csvCalculated Column: line_total
- Inputproducts.csvFill Nulls: price →
mean - TransformJoinitems + products on product_id
- Inputorders.csvRemove Duplicates
- TransformJoin+ orders on order_id
- TransformGroup Bysum line_total by category
- TransformConditional Columnrevenue_tier label
- OutputFile Output
Order items branch
- File Input →
order_items.csv. - Calculated Column —
line_total = quantity * unit_price.
Products branch
- File Input →
products.csv. - Fill Nulls —
price, strategy mean.
First join
- Join — items (left) + products (right) on
product_id, how left.
Orders branch
- File Input →
orders.csv. - Remove Duplicates — keep first.
Second join + aggregate + label
- Join — (items+products) (left) + orders (right) on
order_id, how left. - Group By Aggregate — group by
category;line_totalsum,order_idcount. - Conditional Column —
revenue_tier:line_total >= 5000→ high,>= 1000→ medium, else low. - File Output.
Follow along: preview each Join to watch the table widen as columns from the next dataset attach. Preview Group By Aggregate for the final one-row-per-category result, then Conditional Column to see the tier label appear.
Try it: on Group By Aggregate, open Chart → Bar (category =
category, value = line_total) to compare categories at a glance.
Next steps
You have finished the start path. Pick what fits your next task:
- Learn the editor — the Interface Tour covers every panel.
- Follow an end-to-end example — start with Sales Analysis.
- Look up a node — the Transformations reference documents every node these flows use.
- Read the generated code — run a flow and open its exported Python code; the demo flows make readable, educational examples.
- Try the ML flows — open Projects → Demo → Flows and read the ML Quick Start for the concepts they use.