
Quick Start (5 Minutes)
Quick Start (5 Minutes)
This walkthrough builds your first pipeline end to end: bring in data, clean it, run it, and export Python. In Ciaren, a saved pipeline is called a flow — you'll see that word everywhere in the editor and the API. We'll use the visual editor; an API-only version is at the bottom for developers who want to inspect the REST surface.
Before You Start
-
Ciaren running locally. If you installed from PyPI or used Docker, open
http://localhost:8055. If you run from source in development mode, openhttp://localhost:5173. -
Either the built-in Demo project or a small CSV. Any file with a header row works — for example
sales.csv:order_id,region,amount,notes 1,North,120.5, 2,South,,first order 2,South,,first order 3,,80,
Fastest route: use the built-in Demo project
Every fresh install seeds a Demo project with sample datasets and ready-made example flows, including ML-focused ones. Open Projects → Demo and you can preview, run, and export without uploading anything.
The demo is optional but recommended for a first install — it's the fastest
way to see working examples. The
Demo Project & Tutorials page walks through the
foundational tutorial flows step by step. If you'd rather start empty, launch
the backend with ciaren serve --no-demo or set CIAREN_SEED_DEMO=false.
What you'll build
By the end of this walkthrough you will have a running pipeline that cleans, aggregates, and outputs a summary CSV — plus the equivalent Python script.
1. Pick or Upload a Dataset
If you are using the Demo project, you can skip the upload and use an existing sample dataset.
To upload your own file:
- Open the app and go to Datasets. The drop zone is visible immediately, with the Upload to project dropdown defaulted to your first project (e.g. "Default") — change it if you want the file to land somewhere else.
- Drag your file onto the drop zone, or click it to browse and select one. It accepts CSV, TSV, Excel, Parquet, JSON, JSON Lines, or plain text.
Ciaren infers the column schema and stores a sample. Datasets are versioned — re-uploading a file with the same name adds a new version rather than overwriting the old one, so existing flows stay reproducible.
2. Create a flow
- Go to Flows → New flow. This opens a modal with Name/Description/Project fields and starter templates such as Blank flow, Clean & Deduplicate, Filter & Aggregate, Data Quality Checks, and Tidy Columns. Pick Blank flow for an empty canvas, as this walkthrough assumes.
- Drag a File Input node from the palette, select the dataset you uploaded, and set its File type to CSV.
- Add a few transformation nodes and connect them in order:
- Drop Nulls — remove rows missing an
amount. - Remove Duplicates — drop repeated rows.
- Group by & Aggregate — group by
region, sumamount.
- Drop Nulls — remove rows missing an
- Add a File Output node at the end and connect it.
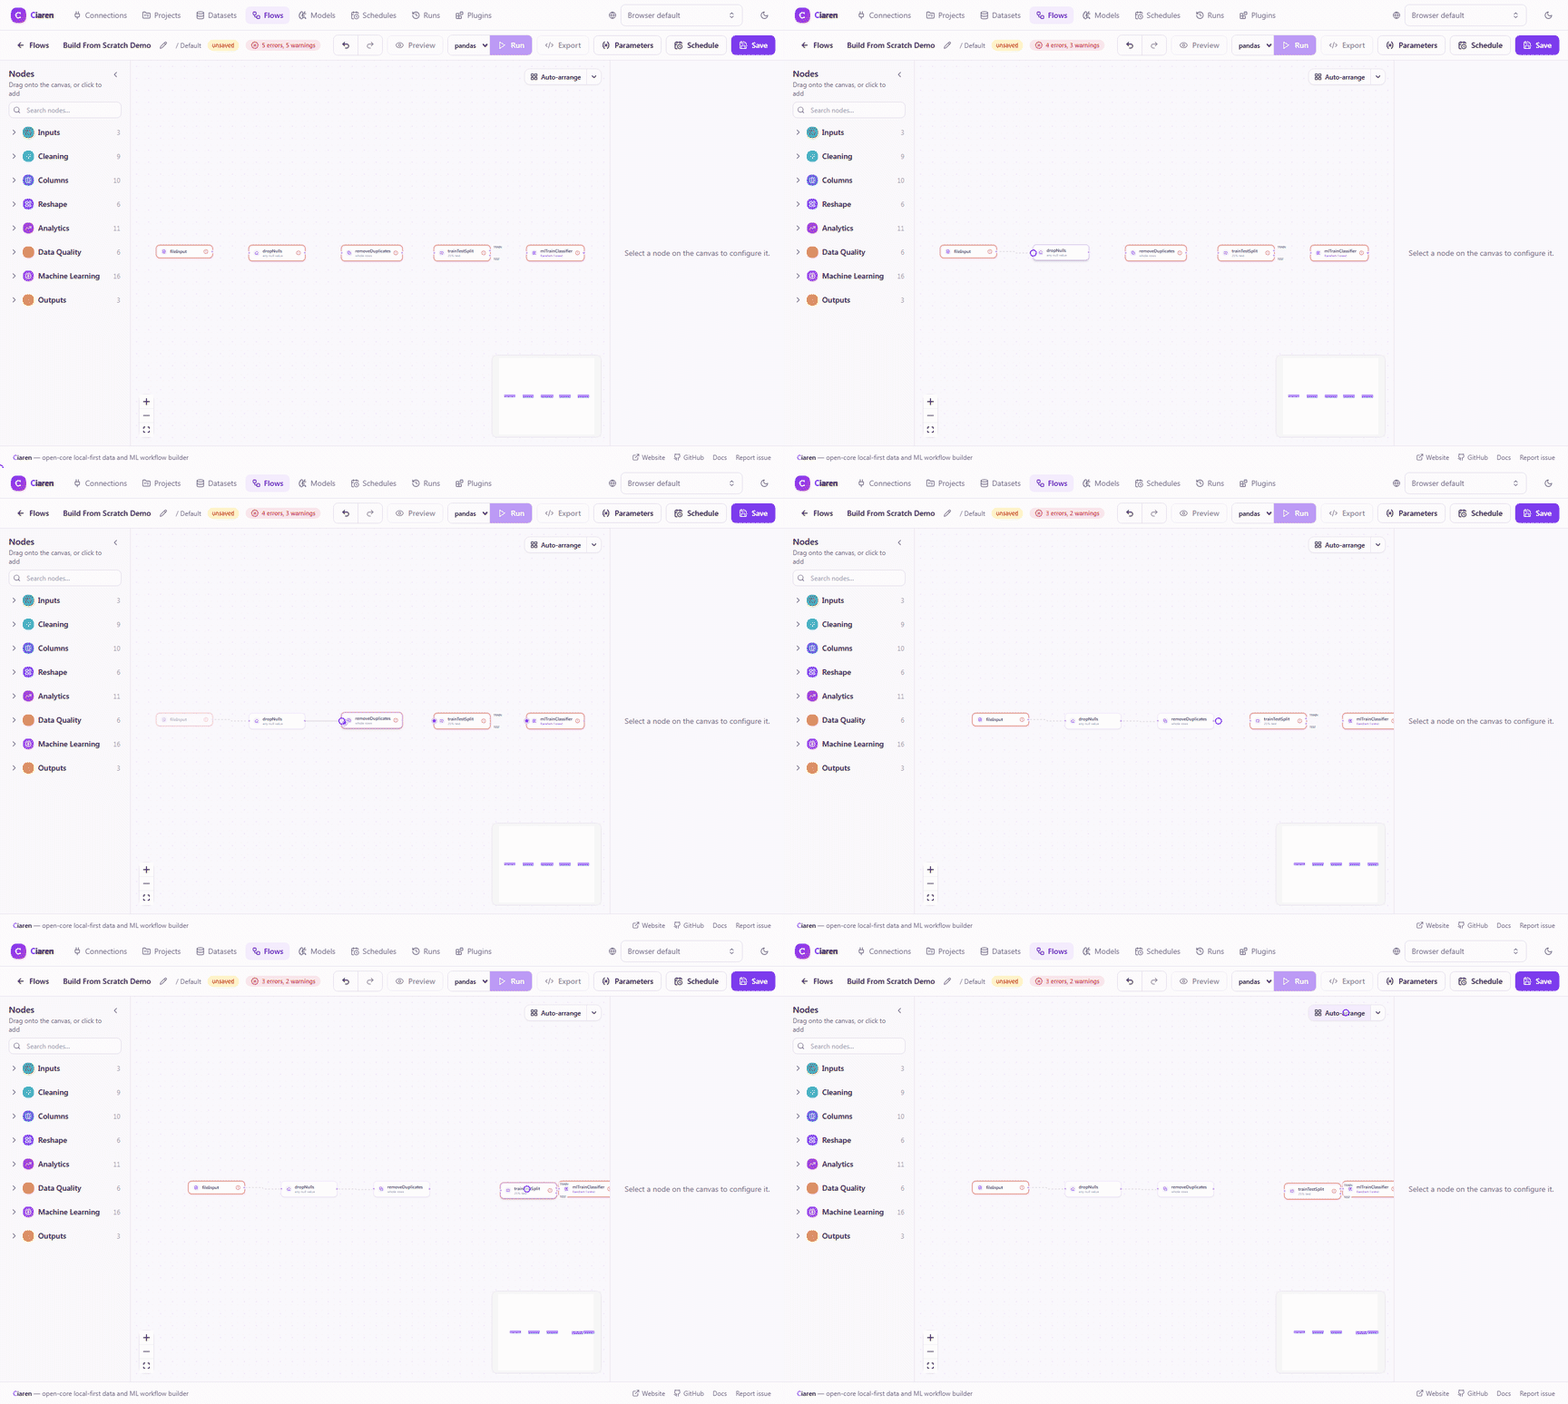
Each node has a config panel on the side. As you edit a node, the live preview updates on a sample of your data, so you can confirm each step before running anything. See the Interface Tour for the full layout and the Transformations Reference for every node.
3. Run the flow
Click Run. Ciaren executes the whole pipeline on the default engine (polars), writes the output file, and records a run with status, logs, and per-node results (row/column counts and a sample).
Open the run from the Runs page to inspect each node and download the output.
4. Export Python
Click Export → Python. Ciaren returns standalone, readable code for your flow, including polars, pandas, and lazy polars variants where available. Paste it into a script or a Jupyter notebook and it runs on its own, no Ciaren required.
5. (Optional) Schedule it
To run the flow automatically, open it and add a Schedule with a cron expression and timezone. The built-in scheduler handles retries, catch-up, and overlap protection. See Scheduling.
Prefer the API?
Everything above is also available over REST. The fastest way to explore it is
the interactive docs at http://localhost:8055/docs.
# 1. Upload a dataset (note the returned id)
curl -F "[email protected]" http://localhost:8055/api/datasets/upload

# 2. Inspect it
curl http://localhost:8055/api/datasets/{dataset_id}/schema
curl http://localhost:8055/api/datasets/{dataset_id}/sample

# 3. Create a flow (a React Flow-compatible graph of nodes + edges)
curl -X POST http://localhost:8055/api/flows \
  -H "Content-Type: application/json" -d @flow.json

# 4. Preview, then run (optionally choose an engine)
curl -X POST http://localhost:8055/api/flows/{flow_id}/preview \
  -H "Content-Type: application/json" -d '{"limit": 50}'
curl -X POST http://localhost:8055/api/flows/{flow_id}/runs \
  -H "Content-Type: application/json" -d '{"engine": "polars"}'
curl http://localhost:8055/api/runs/{run_id}

# 5. Export Python (returns pandas, polars, lazy polars, and a portable .flow document)
curl -X POST http://localhost:8055/api/flows/{flow_id}/export/python
The flow graph format (node types, data.config, and edges) is described in
the Transformations Reference and the
REST API Reference.
Next Steps
- Demo Project & Tutorials — inspect working flows without setup
- Interface Tour — learn the editor
- Transformations Reference — all node types
- Examples — real-world, end-to-end walkthroughs
- REST API Reference — every endpoint