
Interface Tour
The Ciaren editor follows the design system — a purple-based, minimalist layout. This page walks through the main screens.
Top-level pages
Ciaren is organized around a few pages, reachable from the navigation bar at the top:
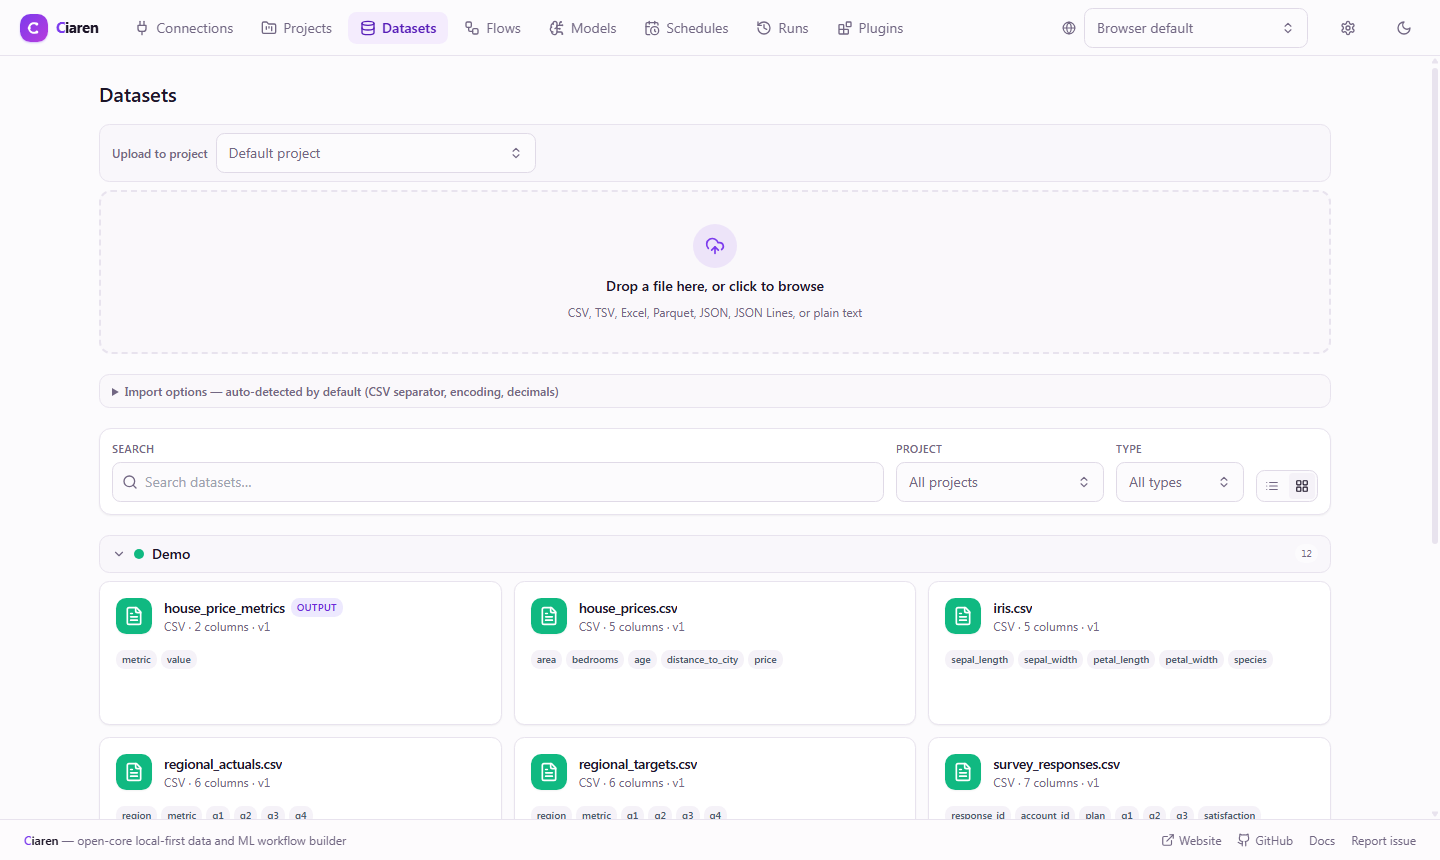
- Landing (
/) — the marketing/start page. - Projects (
/projects) — lightweight workspaces that group related datasets and flows. ADefaultproject always exists. See Projects & Runs. - Datasets (
/datasets) — upload and inspect source files (CSV, TSV, Excel, Parquet, JSON/JSONL, and text), with versioning. Each dataset has a Profile tab with per-column statistics (nulls, distinct counts, ranges, top values), computed at upload time. - Connections (
/connections) — reusable database connections for the SQL Input/Output nodes (PostgreSQL, MySQL, SQLite, SQL Server, MongoDB). Passwords are read from environment variables, never stored. See Database Connections. - Flows (
/flows) — your saved pipelines; open one to edit it on the canvas. - Models (
/models) — MLflow-tracked model registry: registered models with metrics, aliases (@production,@staging), and lineage back to the flow and run that produced each version. Only visible when ML is enabled (on by default). - Runs (
/runs) — execution history; open a run for status, logs, and per-node results. - Schedules (
/schedules) — automated flows; see Scheduling. - Plugins (
/plugins) — install, approve, and manage plugin extensions (custom nodes, connectors, and more); see Plugins Overview and Managing Plugins. - Settings (
/settings, the gear icon on the right of the navigation bar) — runtime server configuration: default engine, execution mode, timeouts, upload and scheduler limits, and ML guardrails. Edits are saved server-side and survive restarts; each setting names itsCIAREN_*variable and shows whether the value comes from a default, an environment variable, or a saved override — while an override exists, the environment variable is ignored until you press Reset. See Advanced Setup.
The flow editor
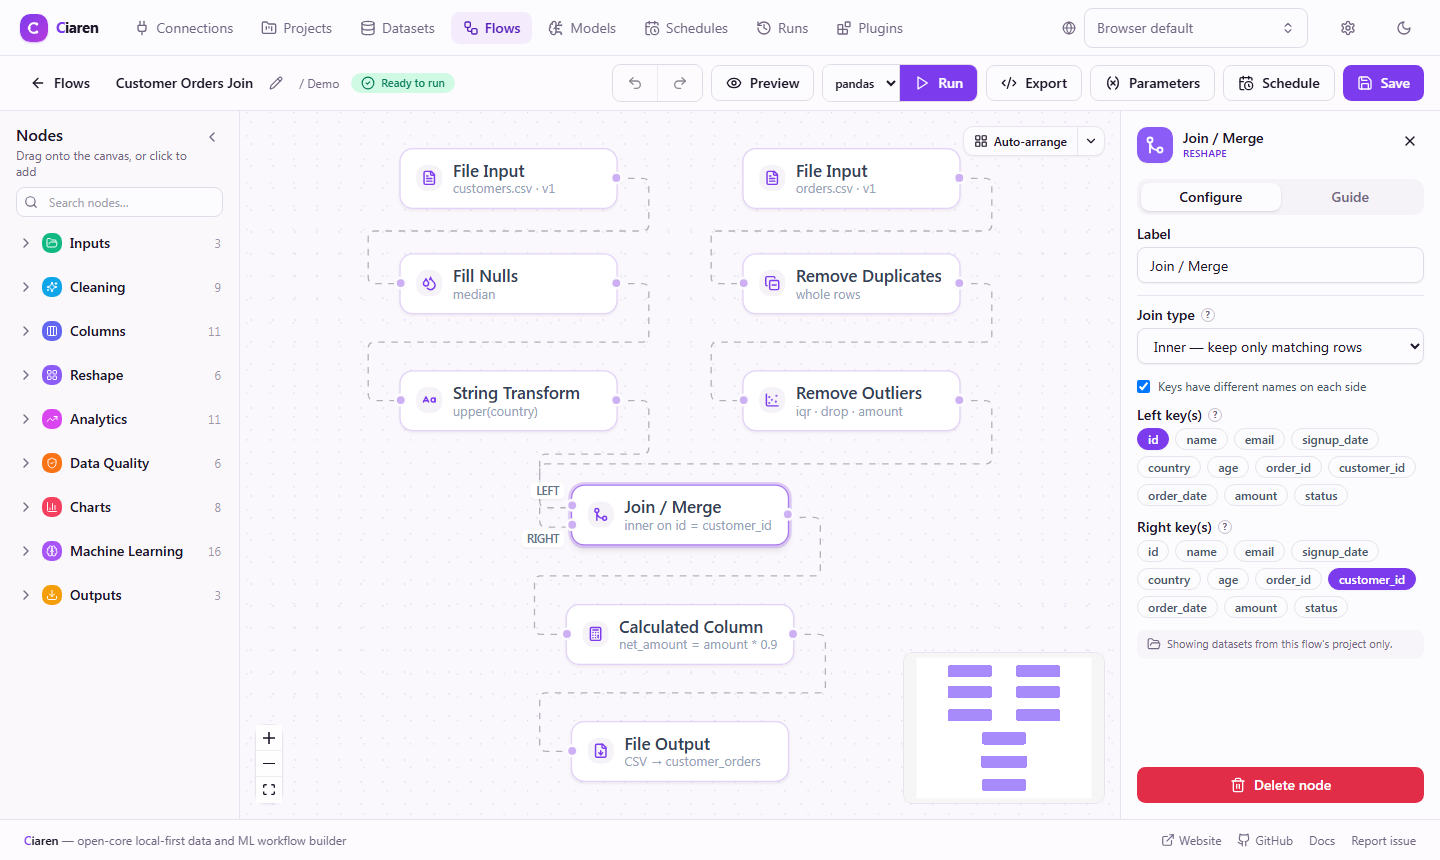
Opening a flow (/flows/:flowId) shows the node-based editor, built on
React Flow. The layout has three main regions:
-
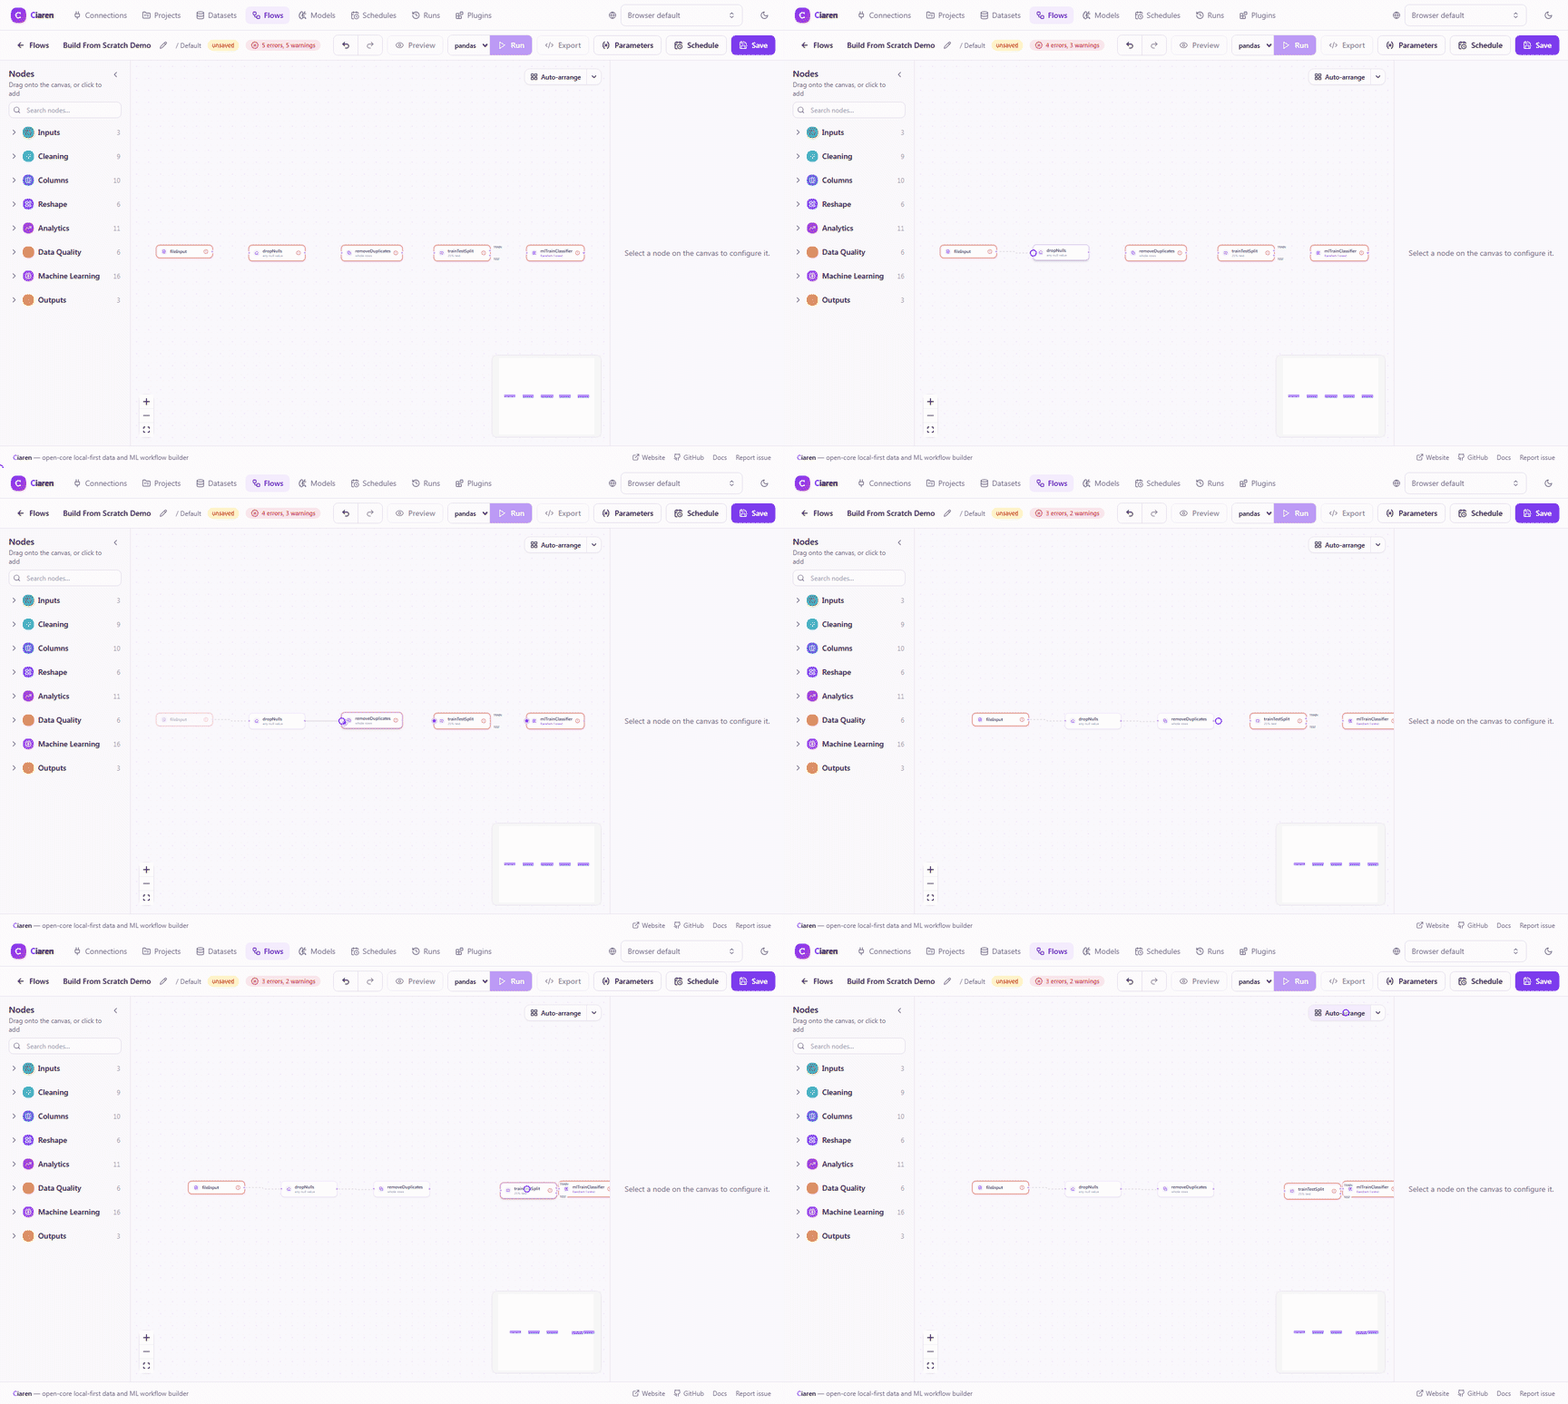
Canvas — where you place and connect nodes. Each node maps to exactly one dataframe operation. Drag from a node's output handle to another node's input handle to create an edge.
-
Node palette — 80 nodes grouped into 9 categories, each with its own color: Inputs (8, emerald), Cleaning (9, sky), Columns (10, indigo), Reshape (6, violet), Analytics (11, fuchsia), Data Quality (6, orange), Charts (8, rose), Machine Learning (16, purple), and Outputs (6, amber). See the Transformations Reference.
-
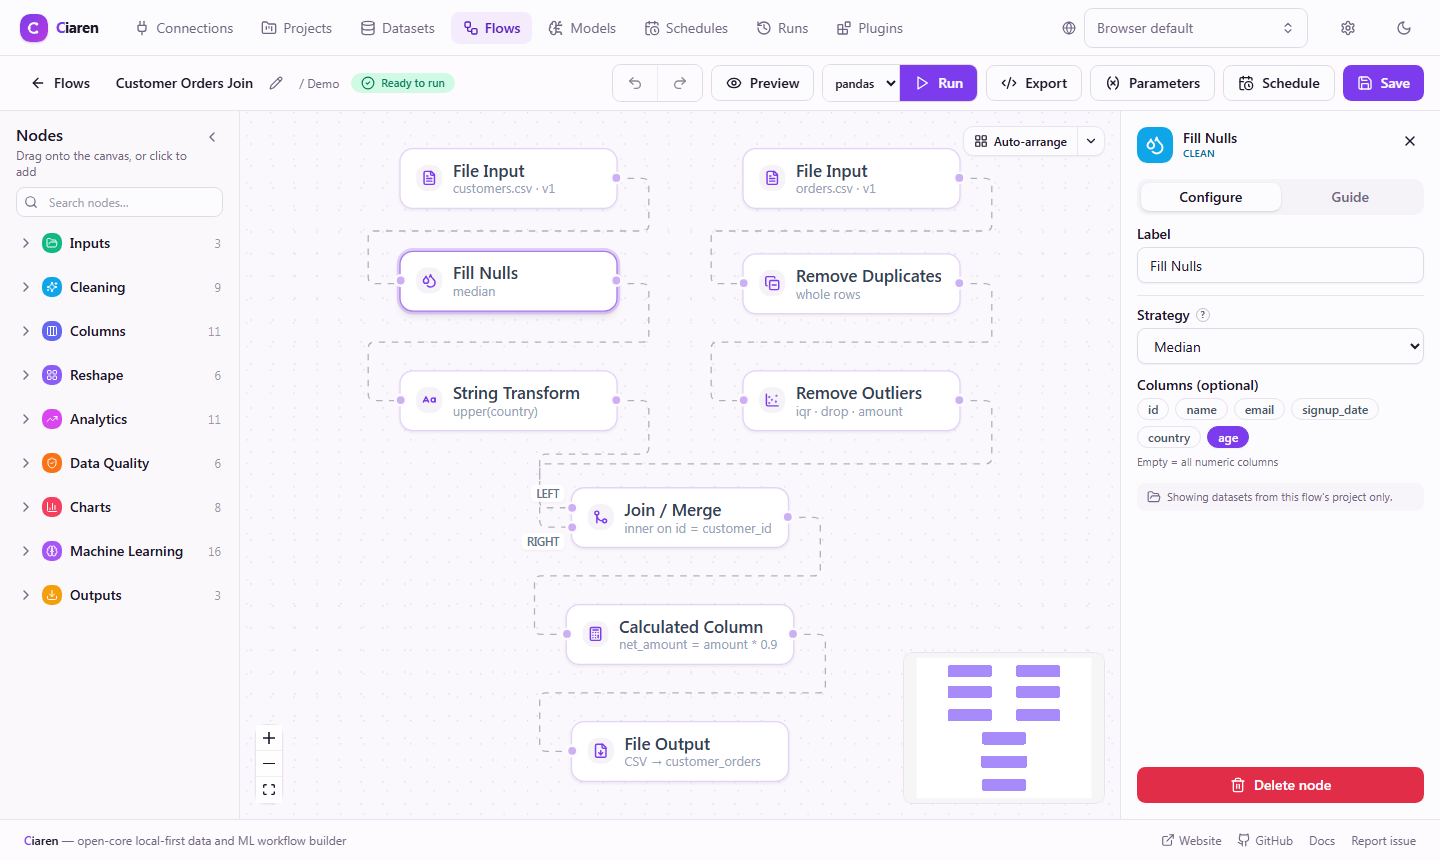
Config panel — per-node settings (column selection, operators, target types, aggregations). Forms are validated as you type for fast feedback; the backend re-validates on run. Click any node to open its config:
-
Live preview — open with the Preview button, then click Run preview to fetch a sample of the output (whole-flow or the selected node). Backed by
POST /api/flows/{id}/previewandPOST /api/transformations/preview. Flow previews use the last saved version of the flow; save before previewing if the canvas has unsaved edits.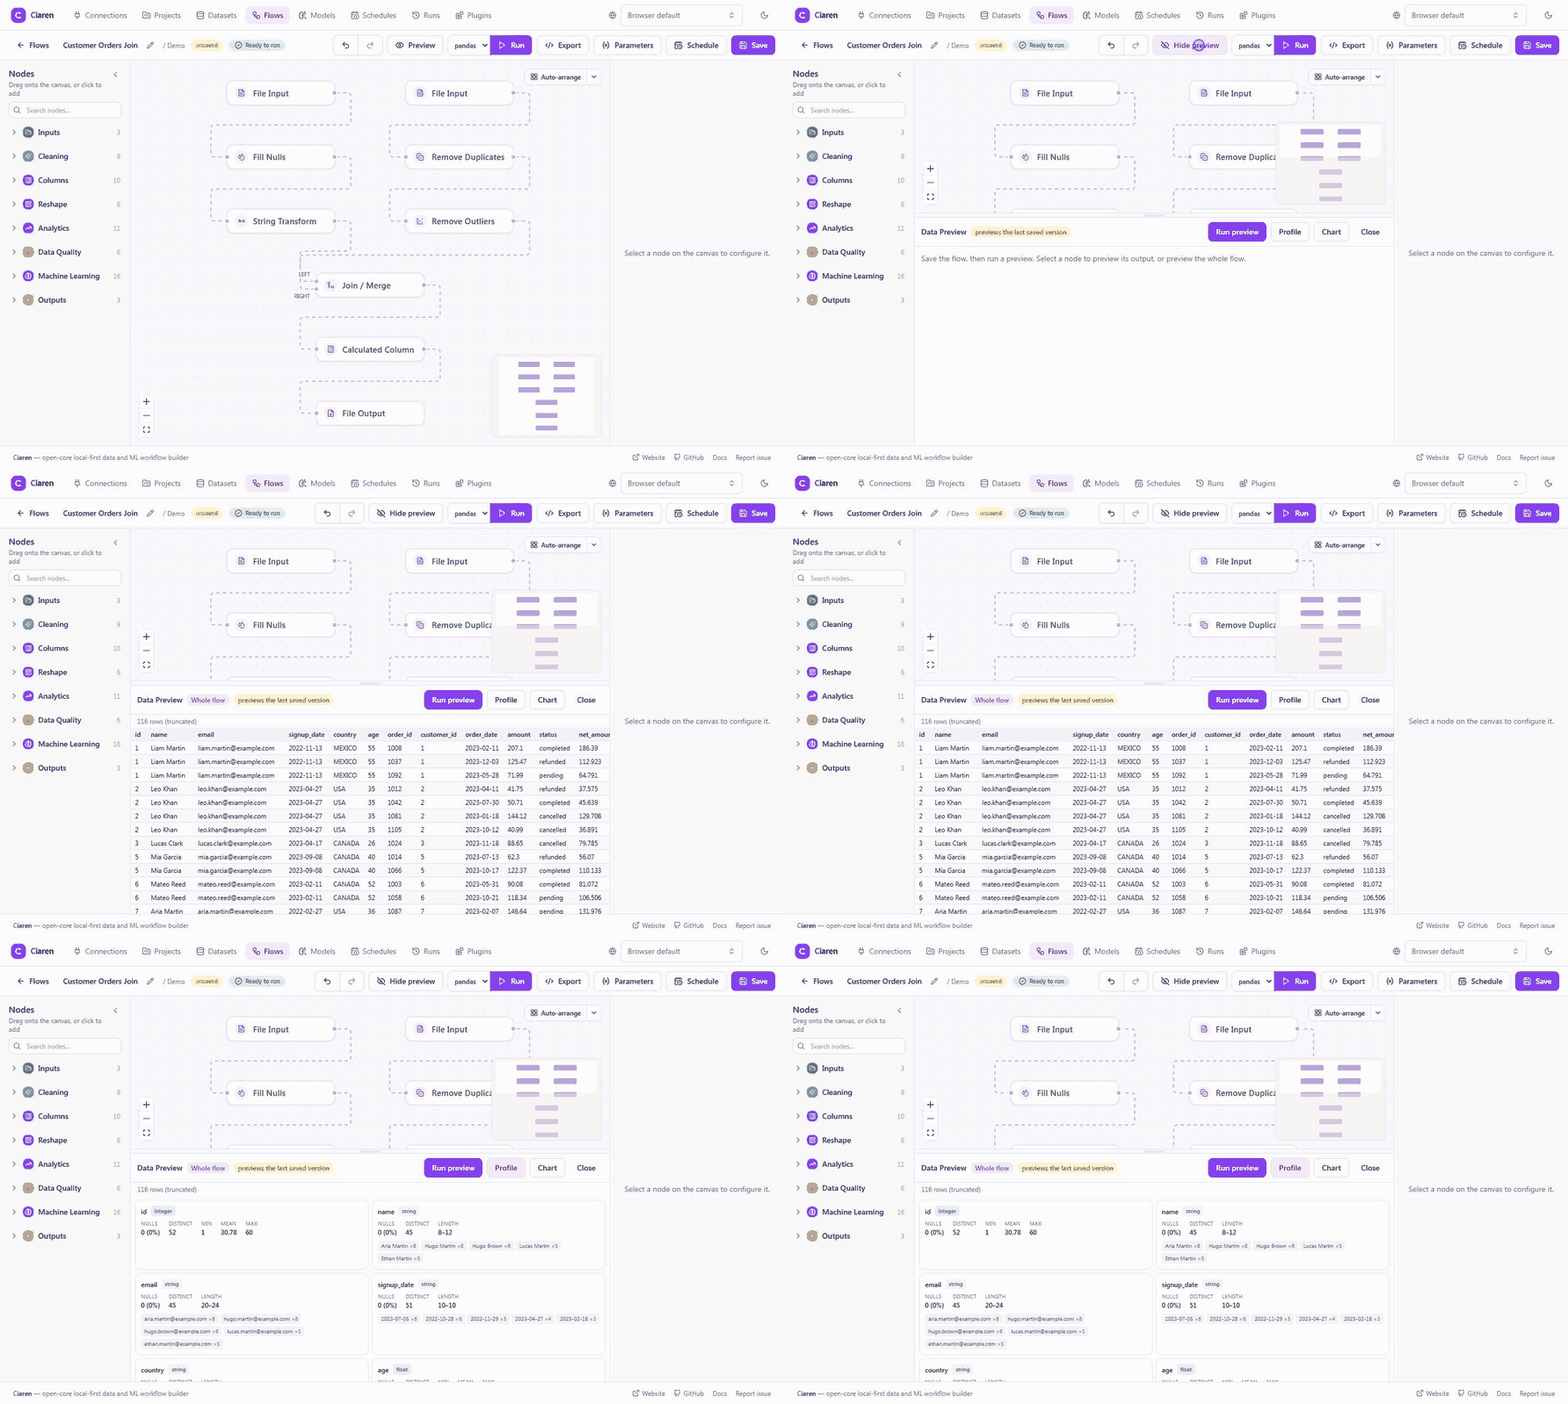
-
Profile — alongside the preview, a one-click Profile view shows per-column statistics for the selected node's output: null count and percentage, distinct count, numeric min/mean/max, datetime range, and the top values for text columns. Request it by passing
profile: trueto the preview endpoints. Stats are computed on a bounded sample so they stay fast on large frames. -
Run — executes the whole flow and records a run.
-
Export — generates standalone Python (polars and pandas) for the flow.
Building a pipeline is drag, configure, connect — no code required to start:
Node handles
Most nodes have a single input handle (in) and a single output handle (out).
Two nodes are different:
- Join has two input handles,
leftandright. - Union / Concat accepts multiple inputs (connect as many upstream nodes as you need to stack).
Runs view
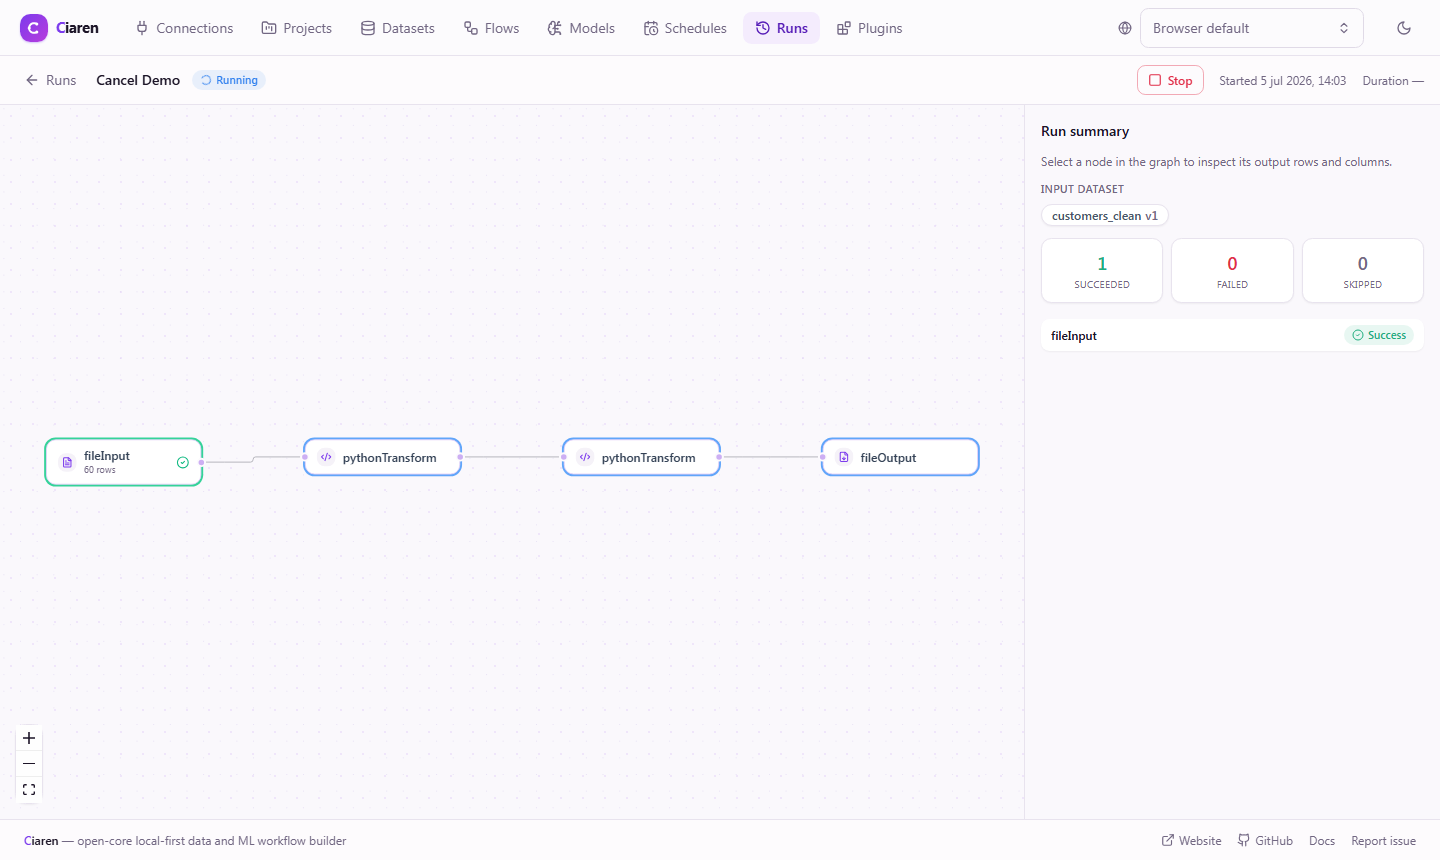
A run's detail page (/runs/:runId) shows the flow as a read-only DAG.
 Each node
reports its status (
Each node
reports its status (success / failed / skipped), row and column counts, a
small sample of its output, and a duration_ms for performance insight. The run
also records which engine it used and the resolved dataset versions, so it is
fully reproducible.
Next steps
- Quick Start — build your first flow
- Transformations Reference — every node and its config
- Projects & Runs — organizing and monitoring work